



Exhibitions can generate value long after the event closes, which makes measuring return more complicated than simply comparing event cost with immediate sales.
For B2B marketers with longer sales cycles, a clearer picture comes from combining exhibition performance with wider sales data – including lead quality, conversion, pipeline and customer value.
This guide shows you how to build a more reliable picture of what your exhibition actually delivered.
What is exhibition ROI?
Return on Investment (ROI) measures the profitability of an investment against its costs, expressed as a percentage using the following calculation:
ROI % = (net profit / cost of investment) x 100
Your cost of investment might be simple to track – stand space, build, logistics – but net profit is harder to define. It goes beyond immediate sales orders to include lead quality, brand exposure, and longer-term customer value.
The formula is straightforward. The difficult part is identifying the full value your exhibition generated.
Step 1: Calculate your total exhibition investment
Before you can calculate exhibition ROI, you need an accurate picture of what the event actually cost.
It can be easy to focus on the most visible expenses (sponsorship package/floor space plus the exhibition stand), but your total investment extends much further. Include all the costs associated with planning, promoting, delivering and attending the event to establish a consistent baseline for measuring return.
What should you include?
| Cost area | Example Detail | Example cost* |
|---|---|---|
| Floor space | Space booked with the organiser, registration/exhibitor fees and any mandatory organiser charges associated with your space. | £12,000 |
Exhibition stand design & build | Stand design and build/hire, flooring, furniture, lighting and other stand features included within your project. | £25,000 |
| AV & technology | Screens, LED displays, audio equipment, hardware, connectivity and other technology used on the stand. | £3,000 |
| Graphics & content | Printed graphics, design, animation, video, interactive media or other content created specifically for the exhibition. | £2,000 |
| Engagement | Interactive games, activations, giveaways, prizes or other experiences used to attract and engage visitors. | £2,500 |
| Show services & logistics | Transport, installation/dismantle, storage, electrics, rigging, venue services and other delivery costs. | £5,000 |
| Travel & accommodation | Hotels, travel, transfers and relevant subsistence for the team attending the event. | £2,500 |
| People | Temporary/event staff, training and other incremental staffing costs directly associated with exhibiting. | £1,000 |
| Marketing campaign | Paid media, email, social content, direct mail, promotional materials and other pre-, during- or post-event campaign activity. | £1,500 |
| Other event costs | Lead-scanning licences, hospitality, insurance or other exhibition-specific expenditure not captured above. | £1,500 |
| Total exhibition investment | £56,000 |
*This is an illustrative example only. Actual exhibition costs will vary depending on the event, stand requirements, engagement tools and technology, location and wider campaign.
In this example, looking only at the £25,000 exhibition stand line would significantly understate the investment required to deliver the full campaign. The total investment of £56,000 provides an accurate starting point for measuring the event’s overall return.
There’s no single cost model that will suit every organisation. What’s important is deciding which exhibition-related costs you’ll include and applying the same methodology consistently.
Step 2: Measure your exhibition performance
Once you know what you’ve invested, the next question is: what did your exhibition actually deliver?
Lead volume is a useful starting point, but it doesn’t tell the whole story. Look across the visitor journey and sales funnel to understand how effectively your exhibition generated engagement, conversations and genuine commercial opportunities.
| Metric | What it tells you |
|---|---|
| Stand footfall | How many visitors came onto or interacted with your stand |
| On-Stand Engagement | How many visitors participated in an activation, interactive game, engagement tool, demonstration or other measurable interaction |
| Meetings | If a smaller, highly targeted event, how many planned or qualified conversations took place |
| Leads | How many contacts and their details were captured |
| Qualified leads | How many leads met your agreed qualification criteria or ICP (Ideal Customer Profile) |
| Opportunities | How many leads progressed into genuine sales opportunities |
| Pipeline | The potential sales value generated from those opportunities |
| Closed revenue | Revenue ultimately attributed to the exhibition |
Generating 100 leads doesn’t tell you whether an exhibition was successful.
If only five were relevant to your business out of 100, the result looks very different from an event that generated 50 leads with 30 qualified opportunities.
Looking at performance across the full journey gives you a much clearer picture of what happened on the stand and what happened as a result.
Not every metric needs to be measured at every exhibition. Choose the metrics that reflect your objectives and, wherever possible, use the same definitions across events so you can compare performance consistently.
Step 3: Connect exhibition performance to commercial value
Exhibition leads can take weeks or months to convert, particularly with longer B2B sales cycles. To understand the commercial value of your event, track how leads progress through your sales funnel:
Lead → Qualified lead → Opportunity → Customer
Use your wider sales data, including conversion rate, win rate, average order value and sales cycle, to understand both the potential and realised value generated by the exhibition.
How much is an exhibition lead worth?
You can use historical conversion data to estimate the potential value of your exhibition leads.
For example:
- 100 qualified leads × 20% opportunity conversion = 20 opportunities
- 20 opportunities × 25% win rate = 5 expected customers
- 5 customers × £20,000 average order value = £100,000 potential revenue
In this example, each qualified lead has an estimated potential value of £1,000.
This is an estimate, not realised revenue. Continue tracking exhibition-generated opportunities through your CRM as they progress into pipeline and closed business. Where relevant, you can also consider customer lifetime value to understand the longer-term value generated by the event.
Step 4: Calculate and benchmark your exhibition ROI
Now you can bring your total investment and commercial results together to calculate your exhibition ROI.
A simple ROI calculation is:
Exhibition ROI = (Revenue generated − Total exhibition investment) ÷ Total exhibition investment × 100
Using our earlier example, if your total exhibition investment was £56,000 and the event generated £100,000 in closed revenue:
(£100,000 − £56,000) ÷ £56,000 × 100 = 78.6% ROI
This means the exhibition generated a 78.6% return above the original investment.
Put your ROI into context
But, percentage alone only tells you part of the story. Compare your results with previous attendance at the same show, similar exhibitions and your wider event programme.
Look at changes in investment, qualified leads, opportunities, pipeline, revenue and ROI to identify which events are delivering the strongest results and where performance could be improved.
As event leads have typically longer B2B sales cycles, continue updating your ROI across 6-12+ months as opportunities convert into closed revenue. This gives you a more accurate picture of the exhibition’s return over time.
Struggling to calculate event ROI? You're not alone.
With over 55 years of experience in maximising exhibiting performance, we have collated our best guidance to help you accurately measure your event ROI, as well as offering some strategies to accelerate ROI at your next event.
We support our clients through their ROI journey to ensure their exhibition investment has the best possible chance to achieve their business objectives.
3 common ROI challenges - and how to solve them

1.
Lengthy sales cycles
It’s difficult to justify an event’s return in a realistic timeframe, when your typical sales cycle is 6-12 months or longer.
Use past event data to predict future return and set smarter targets
Instead of waiting for the full cycle to play out, model return using your existing events and sales data.
Your previous exhibition data can provide a useful performance benchmark. The data can be compiled with your broader sales data to calculate predicted ROI much more accurately:
Previous exhibition data:
- Total event leads collected
- Number of qualified leads added to CRM
- Number of proposals sent post-show
- Opportunities won (volume + value)
- Opportunities still in the pipeline
Organisational sales data:
- Average order value
- Win rate
- Client lifetime value
- Client upsell potential
From this you can estimate:
- Your average lead conversion rate
- Your average lead value
For example:
If your average order value is £50,000 and you close 60% of your exhibition leads, each lead is worth £30,000.
When factoring in lifetime value (£150,000) and upsell potential (30%), your lead value jumps to £117,000.
2.
You've set your event targets. Now what?
You’ve calculated your average lead value and the target number of leads to achieve the desired ROI at your next event. Great! But investing more into your event will impact your ROI calculations… So what’s next?
Spend smarter to maximise ROI
You don’t need to spend more than your competitors to achieve more. What you need to do is spend smartly. Allocate your exhibiting investments in a way that provides the highest return.
Traditional exhibition stand investment:
Traditional Investment - £££
Stand Design & Build
Return - £££
Leads & Sales Orders
Brand Awareness
Nimlok's Bespoke Hire solution - the smart investment:
Nimlok’s Bespoke Hire formula is a cost-effective way to have a stand with the ‘wow’ factor, while also allowing you to distribute a portion of your investment into additional tools for success. This is where reusable stand design, staff training, stand analytics, and digital engagement have a real impact.
Return - £££££
Higher Quality Leads & Sales Orders
Enhanced Brand Exposure
Boosted Customer Relationships
Nimlok's return-boosting exhibition services:
3.
Struggling to measure brand awareness?
Brand awareness is one of the most important – yet intangible – outcomes of exhibiting. It’s hard to quantify, and even harder to link directly to your event’s ROI.
That’s why at Nimlok, we shift the focus from brand awareness to brand exposure:
Brand Awareness is passive
They saw your stand, noticed your logo, and maybe remembered your name.
Brand Exposure is active
They engaged with your brand by playing a game, taking a quiz, or browsing your content.
They interacted.
And interaction is measurable.
And the more measurable your exposure, the easier it is to connect it to ROI.
Use tools that make the intangible, tangible
Nimlok offer several tools that turn passive visitors into engaged participants. And each tool gives you new data to support your ROI.

Engagement Tools - Games, Rewards, Surveys & more
Bespoke for your organisation, interactive stand activities such as digital games and surveys encourage visitors to actively take part in your brand experience.
These tools capture valuable data — contact info, preferences, feedback — that feeds directly into your sales cycle and CRM.
Visitors are more likely to trade their data for a fun or rewarding on-stand experience (think giveaways, competitions or instant wins).
Boosts brand memorability, improving your follow-up success after the show.
“Each play of a digital game is another minute of brand exposure — and another lead opportunity.”

Stand Analytics - Heatmaps & Dwell Time
Using anonymised signals from mobile devices, we track how many people passed your stand, how long they stayed, and where they lingered.
You get insight into how effective your stand is at attracting and retaining attention — even from those you didn’t directly engage.
It gives you visibility over your full exhibition footprint, not just the leads you spoke to.
You can benchmark captured leads vs. total footfall — ideal for assessing efficiency and planning improvements.
“If 1,000 people passed your stand but only 100 leads were captured, that’s useful data — and a growth opportunity.”
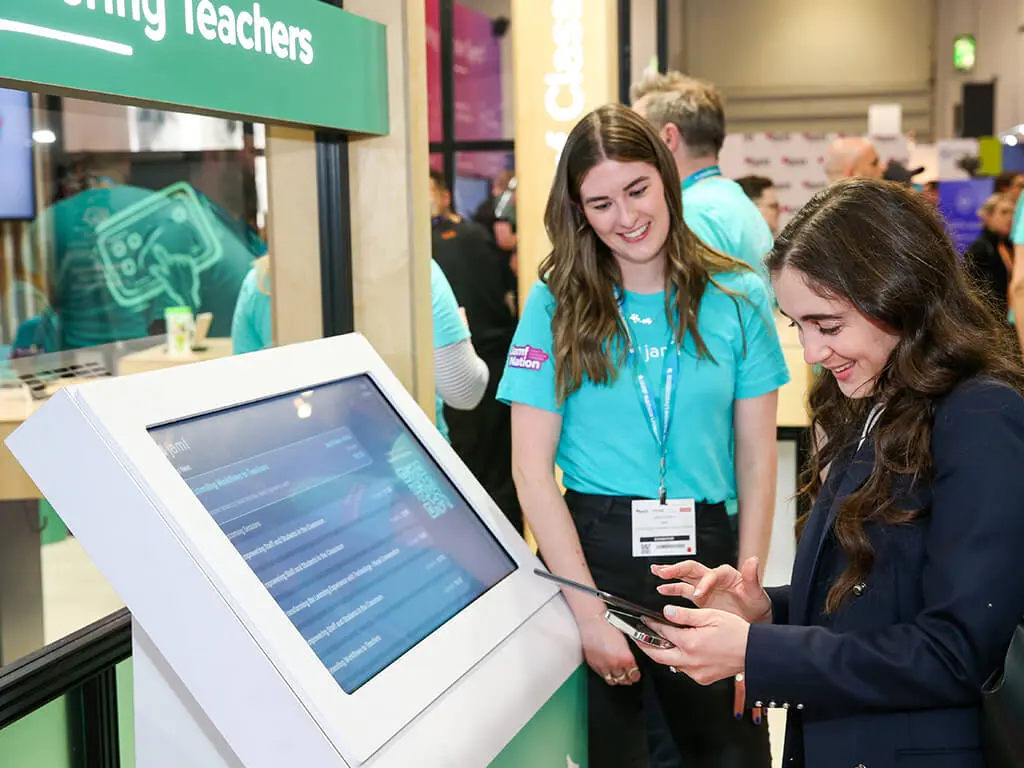
Digital Touchscreens - Digital Content & Data Capture
These self-serve screens allow visitors to browse content, brochures and product info — and request it to be emailed directly to them.
Every content request is a tracked interaction and a data capture opportunity.
You start a post-show conversation automatically by emailing content straight to the visitor.
No more printing, storing or transporting heavy brochures — saving budget and cutting waste.
“Turning printed brochures into digital content is not only trackable — it’s better for the planet, too.”
Quantify your brand's reach with Nimlok's services:
A Smarter Way to Exhibit
Nimlok is more than just a stand builder. We offer a smarter exhibiting formula, shaped by over 55 years of experience.
Our bespoke hire solution gives you high-impact design, while freeing up budget to invest in ROI-boosting tools — from digital engagement games to stand analytics.
With this approach, you don’t just have a great-looking stand on the day. You get a performance-focused exhibiting experience that delivers results long after the event is over.
- More engagement points that lead to data capture
- Higher lead quality through pre-qualified interest
- Stronger post-show performance via improved recall and follow-up
- Measurable outcomes — not just anecdotal feedback
Ready to Turn Your Next Event Into a Measurable Success?
Let’s turn your exhibition investment into results you can track, optimise, and scale.